
Campaign Reports
Learn about in-depth campaign reports across multiple engagement channels.
Campaign reports offer comprehensive insights into several engagement campaigns available on the dashboard, including Email, SMS, App Push, Web Push, and WhatsApp. These reports assist in thoroughly analyzing data, tracking metrics, monitoring trends, and optimizing strategies efficiently. This sheet includes sample reports (both detailed and summary) for all the communication channels.
The report is downloaded to the registered email address.
Click on the channels available in the campaigns section below.
1. Email
Email Campaign Metrics
Email reports provide detailed analytics, showing how your campaigns are performing. You can track important numbers like open rates, click rate, and so on. It helps you make better choices for your email marketing.
Refer to the table below to understand the Email report metrics.
| Metric | Description |
|---|---|
| Open Rate | The open rate is calculated as the total number of times the campaign was opened divided by the total number of contacts who received the campaign. Total number of times emails opened / Total number of contacts email delivered to. |
| Click Rate | Click rate is calculated as the total number of clicks on the links in the delivered campaign divided by the total number of contacts who received the campaign. Note: Click Rate = Total number of clicks on a delivered email/ Total number of contacts email delivered to. |
| Click Map | This report visually displays the total clicks on email links. Each link's click count is a percentage of the total clicks. Note that total clicks are counted, not unique clicks. The Click Map helps identify the most effective links, aiding campaign planning. |
| Link Performance | It gives you a glimpse of the total number of links in the email and the total number of clicks on them. The data shows the number of clicks received by the links. |
| Periodic Trend | It shows the pattern of time during the day when the campaigns are opened and clicked. For example, most emails are opened between 12:00 and 2:00 p.m. Understanding this trend can help you schedule your campaigns when your contacts are most active. |
| Devicewise Trend | This report shows details of how the campaign performs on |
| Domainwise Trend | It gives statistics on email performance based on the domains of the contacts' email addresses. |
| Social Media Trend | When the campaign is shared on social media platforms like Facebook and Twitter, the Social Media trend shows the number of likes, retweets, and so on. |
| Geo Location Report | This report shows the location from which the contact has opened the email. You can use this data to send geo-targeted Campaigns. |
Detailed Email Report
Refer to the table given below to learn the fields available when generating a detailed report for Email channel.
| Field Name | Description |
|---|---|
| Campaign Details | Select information related to the campaign. Options include Message, ID, Campaign Name, Tags, Subject, Sent Date, StatusList, IDList, Names, Seg ID, and Segment Names. |
| Activity Details | Choose metrics related to email interactions. Options include: Bounce Type, Bounce Reason, Open time, Open Day, Latest Link, No. of clicks, First Click, Last Click, Unsub reason, Abuse Reason, Frequency Drop, First Conversion, Last Conversion, Total Conversions, Revenue |
| Attribute Details | Select additional attributes you want to include based on your data fields in the report. |
| Select duration | Choose the length of time you want to generate the report: Today, Yesterday, Last 7 Days, Last 1 Month, Last 3 Months. You can also schedule your reports. Click here to learn the steps to schedule a report. |
| Select Method | Choose the method for receiving the report:
|
The following metrics are available for generating a detailed email report. You can also add custom attributes to tailor the report to your needs. Refer to the table below for a description of each metric.
| Metrics for Detailed Report | Description |
|---|---|
| EMAIL (Primary Key) | Represents the unique identifier for each email record in the report. |
| Mobile | Represents the recipient's mobile number associated with the email. |
| Message ID | Represents the unique identifier for each email message sent. |
| Campaign Name | Represents the name of the email campaign, |
| Tag | Represents tags associated with the email campaign. |
| Subject | Represents the subject line of the email. |
| Sent Date | Represents the date and time the email was sent |
| Status | Represents the current status of the email, such as sent, delivered, bounced, or opened |
| List Names | Represents the names of the user lists. |
| List ID | Represents the unique identifier for the list to which the email was sent. |
| Segment Names | Represents the names of the recipient segments |
| MLAI Tags | Represents tags related to machine learning and AI used in the campaign, |
| Bounce Type | Represents the type of bounce (e.g., hard bounce, soft bounce) that occurred, useful for understanding delivery issues. |
| Bounce Reason | Represents the reason for the email bounce, providing insight into potential problems with email delivery. |
| Open time | Represents the exact time the user opened the email. |
| Open Day | Represents the day of the week the email was opened. |
| Latest Link clicked | Represents the most recent link clicked within the email. |
| No. of clicks | Represents the total number of times links within the email were clicked |
| First Click | Represents the time of the first link click within the email. |
| Last Click | Represents the time of the last link click within the email. |
| Abuse Reason | Represents the user's reason for marking the email as spam or abuse. |
| Unsub reason | Represents the reason given by recipients for unsubscribing from the email list, which is useful for improving future campaigns. |
| First Conversion | Represents the time of the first conversion (e.g., purchase, sign-up) resulting from the email, indicating the initial impact of the campaign. |
| Last Conversion | Represents the time of the last conversion resulting from the email, |
| Total Conversions | Represents the total number of conversions resulting from the email, |
| Revenue | Represents the total revenue generated from conversions attributed to the email |
| Device | Represents the type of device (e.g., mobile, desktop) used to open the email |
| OS | Represents the operating system used by the user to open the email |
| Browser | Represents the web browser used to open the email |
2. SMS
SMS Report
The SMS reports provide the details of the performance of the SMS campaigns. For each campaign, you get to know the number of SMS sent, how many have been delivered and clicked, and the number that could not be delivered due to NDNC.
NoteWhen downloading reports for SMS, it's important to note that user attribution won't be available.
For example, if you send a personalized SMS like "Hey Jane Doe, get 1 coffee free by buying 3 coffees," the report downloaded for analysis will display campaigns using user attribution as "{First Name} {Last Name}" instead of the original name.
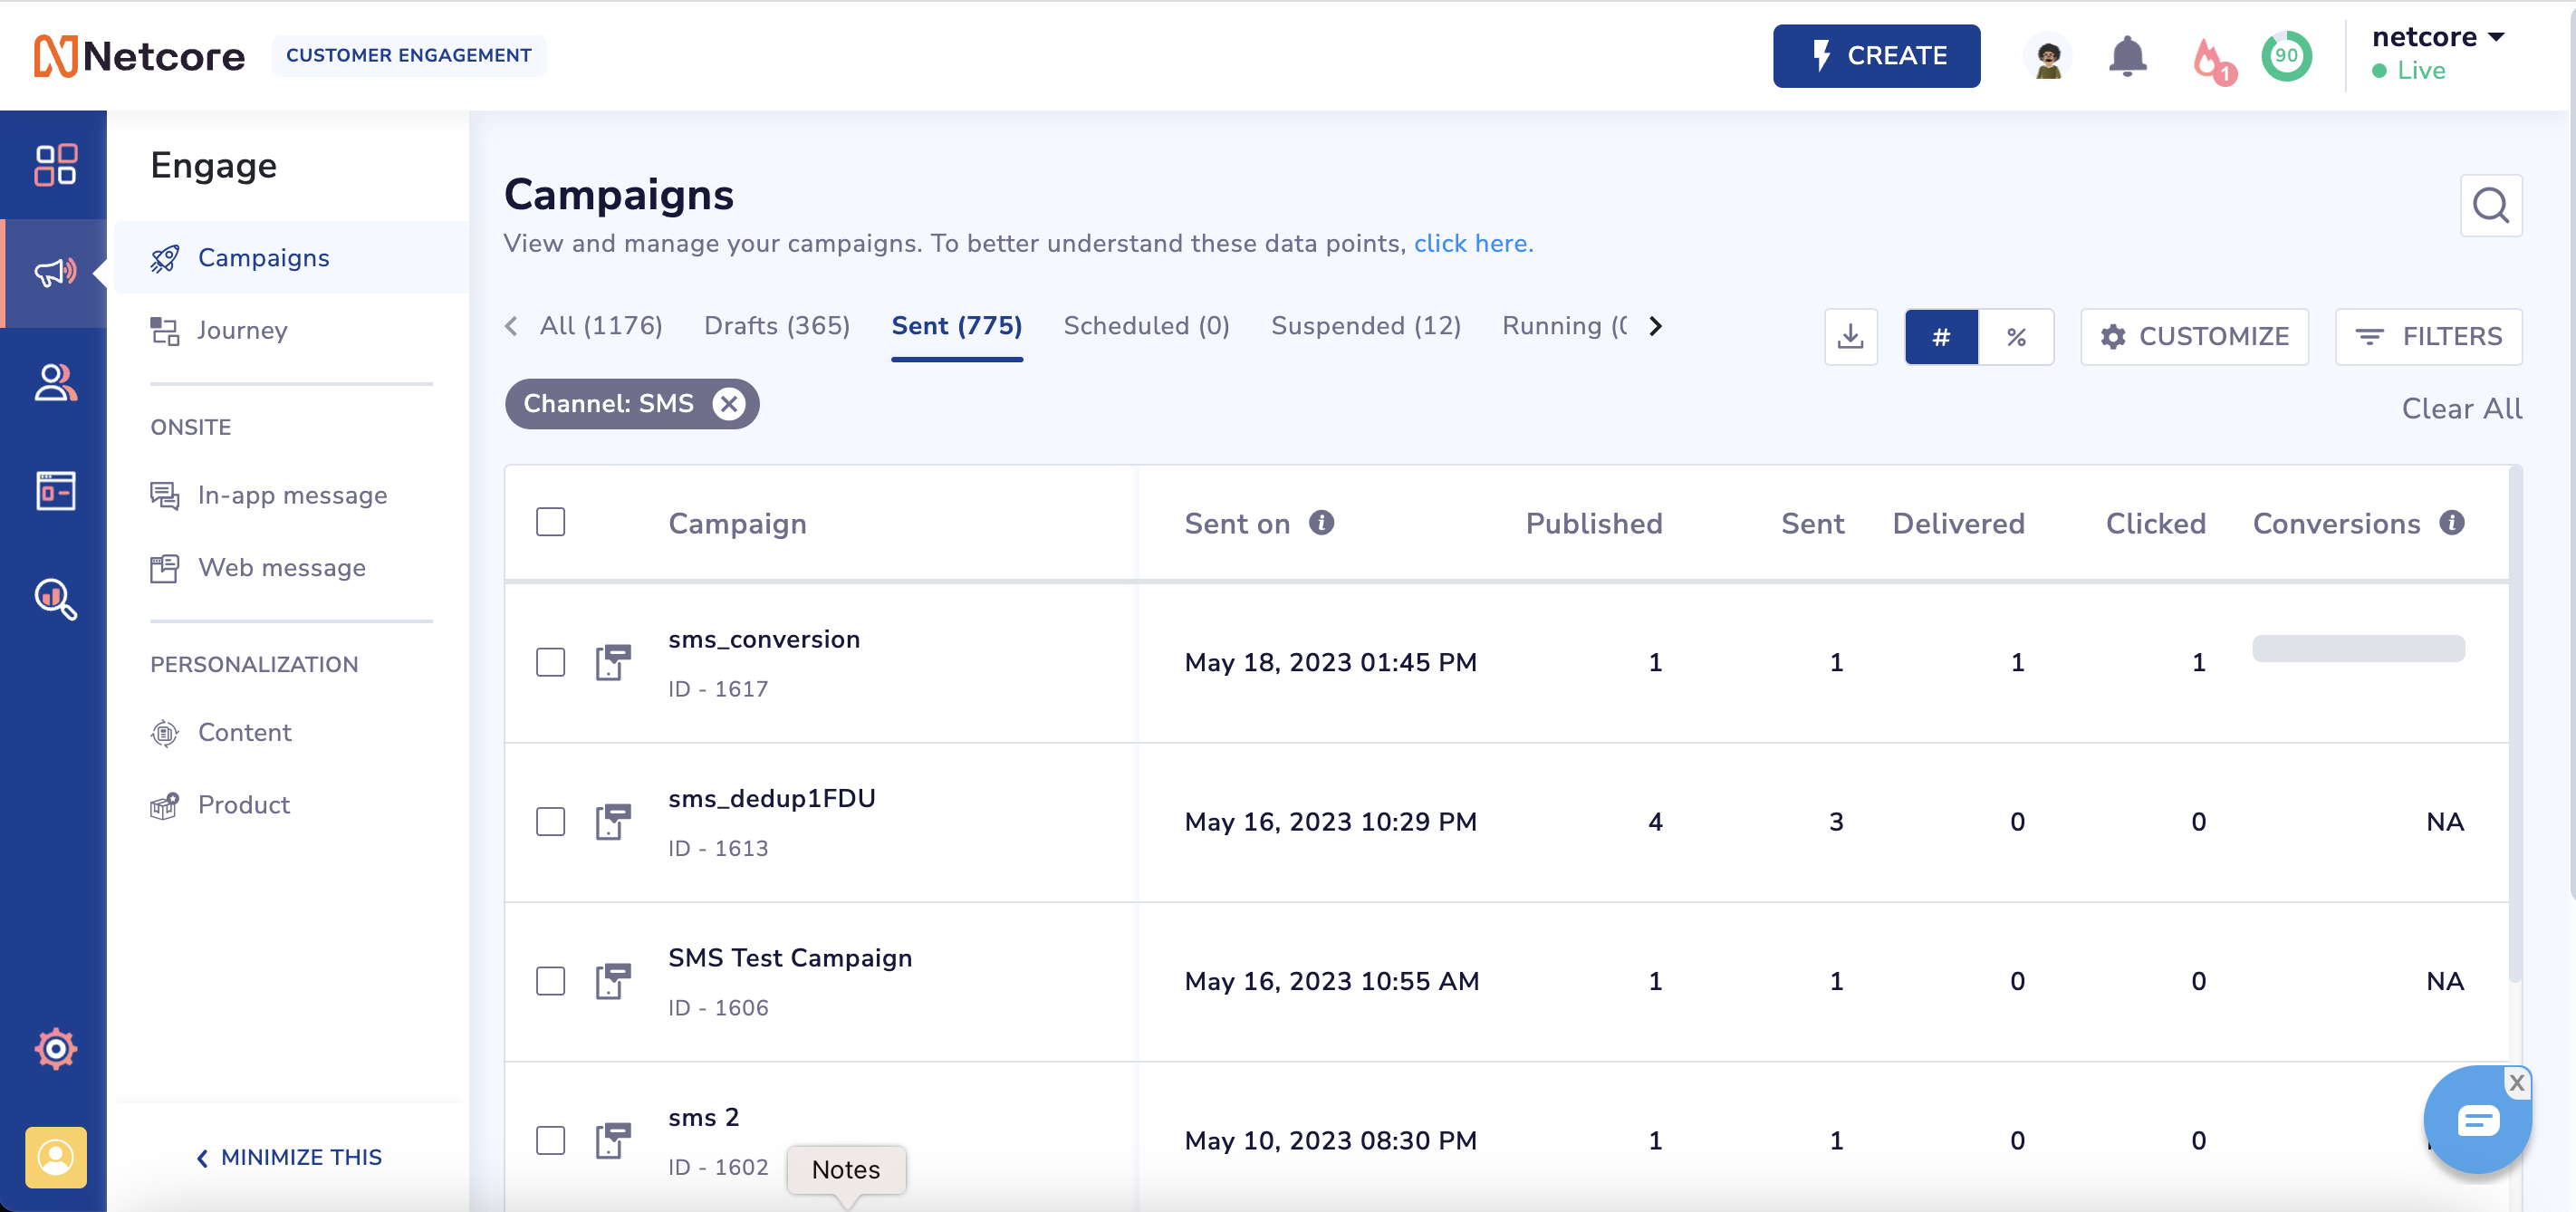
SMS Report
Refer to the table below to understand the SMS report metrics.
| Metrics | Description |
|---|---|
| Published | Represents the total audience targeted in your SMS campaign. |
| Sent | Represents campaigns dispatched from the platform to the users successfully. |
| Delivered | Represents users who have successfully received the SMS. |
| Clicked | Represents the number of users who have clicked the SMS. |
| Conversion | Represents the total number of users who performed the conversion event. |
Points to Remember
- When you download or schedule SMS summary report, you will have the option to choose between Message-wise and SMS-wise reports.
- The message-wise report provides a detailed breakdown of each individual SMS campaign sent.
- The SMS-wise report, on the other hand, provides details counts on Delivered SMS, Undelivered SMS, SMS Submitted to the network, and Total SMS Sent.
- This provides more flexibility and granularity in analyzing your SMS data, giving you the insights you need to make informed decisions.
3. Web Push
Web Push Report
Web push reports give insights into their performance. Track important metrics like click-through rates and conversions to improve your notification strategies and effectively engage your audience.
Refer to the table below to understand the web push report metrics.
| Metrics | Description |
|---|---|
| Published | Represents the total audience targeted in your web push campaign. |
| Sent | Represents web push campaigns dispatched from the platform to the users successfully. |
| Delivered | Represents users who have successfully received the web push. |
| Opened/Read | Represents the total number of numbers who have opened/read the web push. |
| Clicked | Represents the total number of people who have clicked on the web push. |
| Conversions | Represents the total number of users who performed the conversion event. |
| Revenue | Revenue earned from the campaign. |
4. App Push
App Push Report
App push reports give insights into their performance. Track important metrics like click-through rates and conversions to improve your notification strategies and engage your audience effectively.
Refer to the table below to understand the app push report metrics.
| Metrics | Description |
|---|---|
| Published | Represents the total audience targeted in your app push campaign. |
| Sent | Represents app push campaigns that are successfully dispatched from the platform to users. |
| Delivered | Represents users who have successfully received the app push. |
| Opened/Read | Represents the total number of numbers who have opened/read the app push. |
| Clicked | Represents the total number of numbers who have clicked the app push. |
| Conversions | Represents the total number of users who performed the conversion event. |
| Revenue | Revenue earned from the campaign. |
Detailed App Push Report
The following metrics are essential for generating a detailed app push report. You can also add custom attributes to tailor the report to your needs. The table below describes each metric.
| Metrics for Detailed Report | Description |
|---|---|
| Campaign ID | Unique identifier for the campaign. |
| Campaign Name | Name of the app push campaign. |
| Start Date | Date when the campaign starts. |
| End Date | Date when the campaign ends. |
| Primary Key | Unique key for the user receiving the in-app message. |
| Clicked Date | Date the user clicked on the app push. |
| Smartpush | Enhanced delivery status for messages. |
| Action | User action taken on the in-app message (e.g., clicked, viewed). |
| Action Time | Timestamp of the user action on the in-app message. |
| Tags | Tags associated with the campaign for categorization. |
| App Token | Token associated with the app for tracking purposes. |
| OS Type | Operating system type of the user's device (e.g., Android, iOS). |
| OS Version | Version of the operating system on the user's device. |
| App Version | The version of the app displaying the app push message. |
| SDK Version | The version of the SDK used for the app push message. |
| Make | Manufacturer of the user's device. |
| Model | Model of the user's device. |
| Mobile | User's mobile number. |
| User's email address. | |
| Unique Conversions | Represents the number of users who have performed the conversion event for the first time. |
5. Whatsapp
WhatsApp Report
WhatsApp reports give insights into the message's performance. Track metrics like delivery rates and engagement to optimize your messaging strategy and connect effectively with your audience.
Refer to the table below to understand the Whatsapp report metrics.
| Metrics | Description |
|---|---|
| Published | Represents the total audience targeted in your Whatsapp campaign. |
| Sent | Represents WhatsApp campaigns that have been successfully dispatched from the platform to users. |
| Delivered | Represents users who have successfully received WhatsApp. |
| Opened/Read | Represents the total number of numbers who have opened/read WhatsApp. |
| Clicked | Represents the total number of numbers who have clicked WhatsApp. |
| Conversions | Represents the total number of users who performed the conversion event. |
WhatsApp Detailed Report
The following metrics are essential for generating a detailed report. You can also add custom attributes to tailor the report to your needs. Refer to the table to select the data columns to include in the report.
| Header | Sub-header | Description |
|---|---|---|
| Campaign Details | Provide information related to the campaign. | |
| Sent Time | The timestamp when the campaign was sent. | |
| Primary Key | The unique identifier for each contact. | |
| Mobile | The mobile number of the user. | |
| Sender ID | The ID displayed as the sender of the campaign. | |
| Tag | The tag assigned to categorize the campaign. | |
| Header | The header or subject line of the campaign. | |
| Status | The current status of the campaign. For example, sent or delivered. | |
| Template ID | The unique ID of the campaign template used. | |
| Template Name | The name of the template used for the campaign. | |
| List ID | The unique ID of the list targeted in the campaign. | |
| List Names | The names of the lists targeted in the campaign. | |
| Segment ID | The unique ID of the segment targeted in the campaign. | |
| Segment Names | The names of the segments targeted in the campaign. | |
| Activity Details | Select metrics related to whatsapp message interactions. | |
| Activity | The specific activity performed by the user. For example, click or open. | |
| Activity Timestamp | The timestamp of the users' activity. | |
| Remark | Additional comments or notes about the activity. | |
| Responses | The number of responses or interactions received from users. | |
| Revenue | The revenue generated from the campaign activity. | |
| Link URL | The URL link included in the campaign. | |
| Attribute Details | Select additional attributes you want to include based on your data fields in the report. | |
| Device Details | Device | The type of device used by the user. For example, mobile or desktop. |
| OS | The operating system of the user's device. For example, Android, iOS, and Windows. | |
| Browser | The browser used to access the campaign. For example, chrome or safari. |
Select the method for receiving the report. The options include the following:
- Email: Receive the report directly in your email inbox.
- FTP: Access and download the report using File Transfer Protocol (FTP).
- Amazon S3: Store and retrieve the report from your Amazon S3 bucket.
- GCS: Save the report to your Google Cloud Storage bucket.
Refer to this link to download a detailed report.
Refer to this link to schedule a detailed report.
6. RCS
RCS Report
RCS reports give insights into the journey's performance. Track metrics like delivery rates and engagement to optimize your messaging strategy and connect effectively with your audience.
Refer to the table below to understand the RCS report metrics.
| Metrics | Description |
|---|---|
| Sent | Represents RCS messages dispatched from the platform to the operator successfully. |
| Delivered | Represents the number of RCS messages that were received on recipient devices. |
| Opened/Read | Represents the number of unique opens on the RCS messages. |
| Clicked | Represents the unique number of clicks on RCS messages. |
Updated 3 days ago