
Content Personalization Reports
Track content personalization campaign success with our in-depth reports.
Overview
Content Personalization Reports give insights into how your website personalization campaigns are performing. You can track important metrics like views, sessions, clicks, conversions, and revenue. The reports also let you compare your audience’s performance with control groups and filter data by time period and metrics. Generating reports helps you improve your campaigns and boost their impact on your website.
Refer to the table below to know the field available for Content Personalization.
| Field | Description |
|---|---|
| Campaign Name | Displays the name of the personalized campaign being tracked. |
| Edited by | Displays the name of the user who last edited the campaign. |
| Starts - Ends | Displays the start and end dates of the campaign. |
| Sessions | Displays the number of user sessions during which the campaign was viewed. |
| Views | Displays how many times users viewed the campaign content. |
| Clicks | Displays the total number of clicks on the personalized content. |
| Conversion | Displays the number of successful conversions resulting from the campaign. |
| Revenue | Displays the total revenue generated from the campaign’s conversions. |
| Report/Performance | Provides access to the performance report on the dashboard itself. Click on View to view the personalization report. |
The following functionalities are available on the Content personalization screen.
| Functionality | Description |
|---|---|
| View in Percentage/Number | View in Percentage presents data in percentages, while View in Number displays the exact data count. Click  on the top right of the campaigns page to view the data as per your choice. on the top right of the campaigns page to view the data as per your choice. |
| Filters | Apply filters like Date Created, Edited By, and Tags to refine and focus the report on relevant data. |
| Search | Search for campaigns by their name or ID. |
| Campaign Priority | Set the priority of campaigns to determine which personalized content the user will see first. |
| Download Report | Download either all campaign reports or just selected campaigns as a CSV file. |
Download Content Personalization Report
- Log in to the Netcore CE dashboard.
- Navigate to Engage > Content under Personalization. The Content personalization screen appears.
- Click
 to download reports for all or selected campaigns. Refer to this sheet for a sample report downloaded as a CSV file.
View Report/Performance
Click on View to view the report/ performance of a specific campaign. This screen provides detailed insights into your personalization campaign's performance. The personalization campaign name is displayed at the top left beside the website name.
Choose the duration for which you want to view the campaign data. The following options are available in the dropdown menu: Last 7 Days, Last 30 Days, Last 90 Days, Custom Range
View Report/Performance of Personalization Campaigns
The two sections available here are:
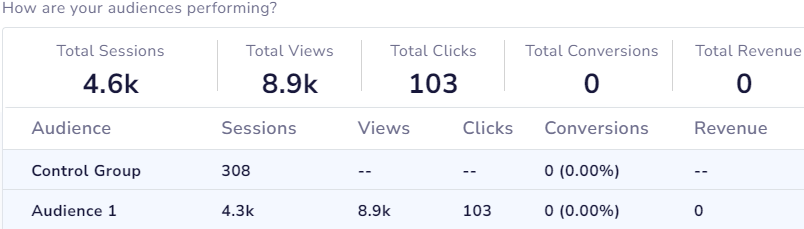
How are your audiences performing?
This section summarizes key metrics such as Total Sessions, Total Views, Total Clicks, Conversions, and Total Revenue for the audience groups in your personalization campaign. Below the performance summary is a detailed breakdown of audience groups and control group added to the personalization campaign.
Audience Performance
How is your Audience performing against the control group?
This graph compares your audience's performance with the control group, helping you measure the impact of your personalization efforts. The functionalities available here are:
Filter data by metrics
Select the desired metric to filter the data from the dropdown menu. Available metrics are: Views, Sessions, Conversions, Clicks
View data by time period
Select how you want the data displayed over time. Available time formats are: Day, Week, Month. The line graph will adjust accordingly, with the selected metric displayed on the y-axis and the date range on the x-axis.
Performance Comparison: Audience vs. Control Group
Updated about 1 month ago