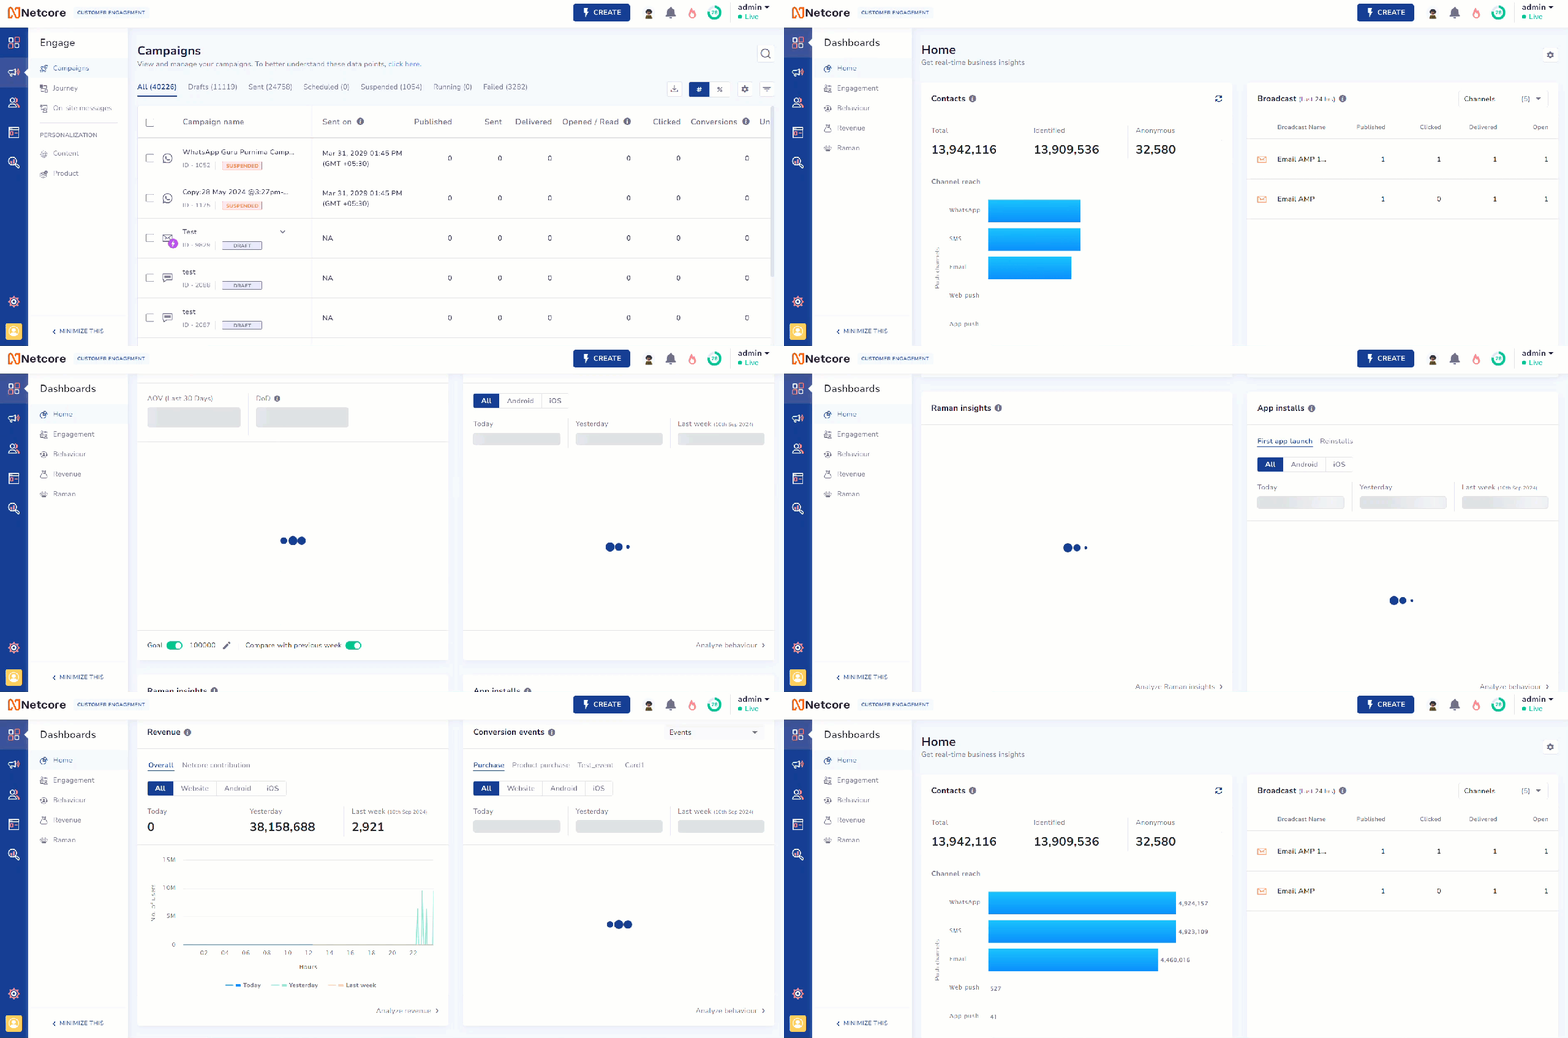
Home Dashboard
Get real-time business insights on the Netcore CE home dashboard.
Overview
The Home Dashboard on the Netcore CE dashboard gives you a quick view of your key business metrics. You can customize it to suit your needs. Each widget links to a detailed report. Admin and sub-admin users can turn widgets on or off and change their order.
Navigate to Dashboards > Home to view the Home dashboard.

Get Real-Time Business Insights on Home Dashboard
Refer to the table to know the widgets available on this dashboard.
| Widget Name | Description |
|---|---|
| Contacts | Displays the total number of contacts, including both identified and anonymous users. It also shows the reach of each channel in your campaigns. |
| Campaign | Provides an overview of communication set across push channels. |
| Active App Users | Displays the number of users who have launched your mobile app at least once within a specified time. |
| Co-marketer Insights | Co-marketer analyzes large datasets to generate business insights. |
| App Installs | Shows the total number of users who installed and launched your app. |
| Revenue | Reflects the total revenue generated based on events tracked in the Revenue dashboard |
| Conversion Events | Displays the total number of conversions based on events tracked in the Behavior dashboard |
1. Contacts
The Contacts widget gives you an overview of your entire contact list, including identified and anonymous users. It also displays a graph showing channel reach for each push channel. These graphs indicate how many contacts can be reached through specific channels.
Click View MTU to see the number of unique user profiles engaged with your website, mobile app, or store during a specific month.
Click Analyze Contacts to go to the All Contacts screen, where you can manage, filter, and customize your contacts. You can take actions like deleting contacts, adding new ones, and viewing detailed contact logs.
2. Campaign
The Campaign widget gives an overview of communications sent across push channels. Use the dropdown to select the channels you want to view. The widget displays displays data for communications sent in the last 24 hours.
Click Analyze My Campaigns to navigate to the Campaigns screen, where you can view and manage all your campaigns.
3. Active app users
The Active App Users widget displays the number of users who launched your mobile app at least once in a given time period. The widget displays graphs and numbers for today, yesterday, and last week, covering Android, iOS, or both under All tab.
Click Analyze Behaviour to go to the Behaviour Dashboard for detailed metrics and insights on how users interact with your brand.
4. Co-marketer
Co-marketer analyzes large amounts of data to give you useful business insights. It can show you trends, like an increase in app launches or a drop in Checkout activity and so on. These insights help you understand user behavior and make better decisions to improve your app and business performance.
5. App installs
The App installs widget shows the total number of users who installed and launched your app. It has two sections:
- First App Launch: This metric tracks users who have installed and opened your app for the first time.
- Reinstalls: This section shows the number of users who have previously uninstalled your app and have now reinstalled it.
The widget displays graphs and numbers for today, yesterday, and last week, covering Android, iOS, or both under the All tab. Click Analyze Behaviour to go to the Behaviour Dashboard for detailed metrics and insights on how users interact with your brand.
6. Revenue
The Revenue widget allows you to track your business's revenue data. It displays Overall and Netcore contribution revenue. The widget displays graphs and numbers for today, yesterday, and last week, covering Website,Android, iOS, or both under All tab.
Click Analyze revenue for a unified view of all the revenue-related metrics on the revenue dashboard.
7. Conversion events
The Conversion events widget presents a live view of converting users and total conversions across your website and mobile app. The widget displays graphs and numbers for today, yesterday, and last week, covering Website,Android, iOS, or both under All tab.
Click Analyze behavior for a unified view of all the conversion metrics on the behavior dashboard.
Updated over 1 year ago
