
Cohorts
Leverage Cohorts for targeted segmentation and improve user engagement.
Overview
The Cohorts functionality in Netcore's CE dashboard allows you to segment users by shared traits or behaviors. You group users into cohorts to analyze patterns, track performance, and tailor marketing strategies to specific segments. Use cohort analysis to enhance user engagement, improve retention, and drive better business performance.
In this guide, you learn the essential concepts and functionalities of Cohorts on Netcore’s CE dashboard.
Benefits
Here are the key benefits of Cohorts.
- Targeted Marketing: Address each cohort's needs and preferences to enhance campaign relevance.
- Improved User Retention: Identify and address pain points to boost retention rates.
- Data-Driven Decisions: Make informed decisions using cohort analysis and user data.
- Performance Tracking: Monitor user segments over time for long-term marketing impact understanding.
Create a Cohort
Follow below steps to create a Cohort.
- Click the Analytics button on the CE dashboard.
- Select Cohorts > Create Cohort.
Create a Cohort
- Select the specific First activity and Return activity representing the behavior you want to analyze.
For example: First activity is App launch, and return activity is Add to Cart. - Choose the time period for which you want to observe your cohort's behavior.
- Select the Contacts from which you want to create the cohort.
- Provide a Cohort name and click Save to save the new cohort.
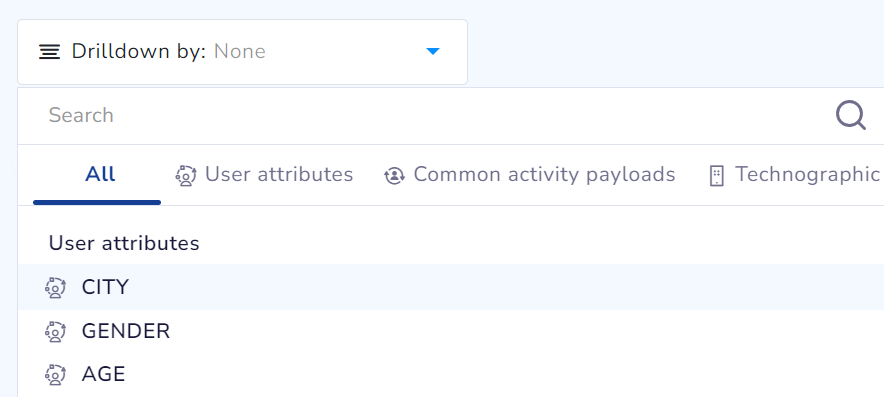
Access Drilldown Cohort
The drilldown feature lets you delve into user cohorts by examining specific attributes or event payload parameters. This functionality enables you to create precise and impactful marketing campaigns. Find detailed examples and practical use cases of utilizing the drill-down feature here.
Steps to access Drilldown feature
- Access the Drilldown option located above the chart/graph.
- Select from the dropdown menu. The functionalities available here are:
- User Attributes
- Common Activity Payloads
- Technographic
Drilldown feature in Cohorts
Refer to the table below to know about the functionality present under drill-down.
| Functionality | Definition | Use Case | Example Scenario | Insights |
|---|---|---|---|---|
| User Attributes | Includes attributes such as Age, Gender, and City. | Understand how specific user attributes (For Example: Age, Gender) influence cohort behavior. | Observe a cohort based on App Launch and explore how different age groups behave. | Understand the engagement patterns of different age groups within the cohort. |
| Common Activity Payloads | Lists common parameters from first and return activities. | Analyze detailed information related to specific activities (For example: items- category, items- price). | Analyze a cohort based on Add to Cart and Checkout activities to explore specific product categories. | Identify which product categories significantly contribute to cart additions and checkouts. |
| Technographic | Displays technographic details for app activities, including OS Version, App Version, SDK Version, Make, and Model. | Gain insights into the technical aspects of user engagement, such as device and software specifics. | A gaming platform aims to enhance its app performance by analyzing the operating systems utilized by its users. | Technographic displays 70% of users are on iOS, suggesting a high Apple device user base. This prompts prioritizing iOS app optimizations for better engagement. |
Use Cases of Drilldown
Here are scenarios across various sectors where you can effectively use the drilldown feature in cohort analysis.
- E-commerce D2C Brands
Problem Statement: E-commerce brands need to understand user behaviors and preferences to improve user engagement.
Solution
Demographic Analysis: Customize marketing messages to different age groups within a cohort.
Gender-based Insights: Analyze purchase behavior based on gender to customize product recommendations.
Device Performance: Understand the impact of app versions on user engagement and update strategies accordingly.
Cart Abandonment Analysis: Drill down into reasons for cart abandonment by examining user behaviors leading up to the event.
Post-Purchase Behavior: Analyze post-purchase activities of different cohorts to enhance loyalty programs.
- BFSI
Problem Statement: Financial services institutions need to cater to diverse customer needs and detect potential fraud to ensure customer security.
Solution
Customer Segmentation: Analyze how different age groups utilize financial services to tailor product offerings.
Transaction Patterns: Drill down into transaction types to identify high-value financial activities.
Technology Usage: Evaluate how different mobile app versions affect the usage of online banking services.
Loan Repayment Behavior: Understand repayment behaviors across different demographic segments to optimize loan offerings.
Fraud Detection: Analyze transaction patterns and behaviors to identify potential fraud activities.
- Travel
Problem Statement: Travel companies need to understand booking behaviors and preferences to enhance customer experiences and optimize offerings.
Solution
Booking Behavior: Understand booking patterns across different age groups to offer personalized travel packages.
Seasonal Trends: Analyze the impact of travel seasons on booking activities to optimize marketing campaigns.
Device Preferences: Examine which devices are most commonly used for bookings to enhance user experience.
Cancellation Patterns: Drill down into the reasons and timing for booking cancellations to improve customer retention strategies.
Customer Journey Analysis: Analyze the complete travel journey from booking to post-trip feedback to enhance service quality.
Compare Segments
The Compare Segments feature allows you to compare cohorts across different user segments. It reveals the retention patterns for various user personas. This helps you design effective campaigns for revenue generation.
To use the Compare Segment functionality do the following:
- Navigate to the Cohort analysis dashboard.
- Click + ADD SEGMENT and select a segment from the dropdown list. You can search any segment with name in the search section.
Compare Segments in Cohorts
Guidelines to Compare Segments
- Segments already selected in the main contacts filter do not appear in the dropdown list.
- You can add up to four segments for comparison, in addition to the default segment.
- Once selected, four cards display the comparison data for each segment.
View Comparison Data
The comparison affects only the top chart. The cohorts table below shows data for the default segment(s). The trend chart shows all cohort data and the overall values of the selected segments. The chart displays five values at a time. You can change the displayed values using the dropdown on each card.
% icon presents data in form of percentage, while # icon displays the exact count of the data. Click 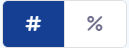 to view the data as per your choice.
View Cohorts Data in Percentage or Numbers
Points to Remember
- You cannot use the Drilldown feature and the Compare Segments feature at the same time.
- If the Drilldown feature is active, the + ADD SEGMENT button is disabled with a hover message.
- If the Compare Segments feature is active, the drill-down and search options are disabled.
- Data loads in 15 seconds for each cohort change or condition added.
Use Cases of Compare Segments
- E-commerce D2C Brands
Problem Statement: E-commerce brands need to identify and understand various user segments to improve retention and optimize marketing efforts.
Solution
Product Category Retention: Compare retention rates of users across different product categories to optimize inventory and marketing.
Promotional Effectiveness: Evaluate the effectiveness of different promotional campaigns by comparing cohorts of users exposed to various promotions.
High-Value Customers: Identify high-value customer segments and focus efforts on improving their retention.
Seasonal Buying Trends: Compare user segments based on seasonal buying patterns to enhance targeted promotions.
New vs. Returning Customers: Analyze the retention patterns of new customers against returning customers to refine marketing strategies.
- BFSI
Problem Statement: Financial services institutions need to compare usage patterns across different segments. They do this to improve their service delivery and customer retention.
Solution
Service Utilization: Compare the usage patterns of different banking services (e.g., savings accounts, loans) to enhance customer engagement.
Financial Product Adoption: Analyze how different customer segments respond to new financial products.
Churn Analysis: Identify factors contributing to customer churn across different segments to improve retention strategies.
Branch vs. Online Banking: Compare user engagement between branch users and online banking users to optimize service delivery.
Investment Behavior: Analyze the investment behaviors of different customer segments to tailor financial advice and product offerings.
- Travel
Problem Statement: Travel companies need to compare booking patterns and preferences across user segments. They do this to optimize their services and marketing strategies.
Solution
Destination Preferences: Compare booking patterns for different travel destinations to tailor marketing efforts.
Customer Loyalty: Evaluate loyalty program effectiveness by comparing cohorts of frequent travelers.
Travel Package Popularity: Identify which travel packages are most popular among different user segments to optimize offerings.
First-time vs. Repeat Travelers: Compare the behaviors of first-time travelers versus repeat travelers to enhance customer experience.
Travel Duration Preferences: Analyze travel duration preferences across different segments to offer better travel packages.
Actionability in Cohorts
Actionability in Cohorts allows you to turn behavioral patterns into targeted engagement. Once you create a cohort segment, you can act on it instantly to improve retention or re-engagement.
The key benefits include:
- Check reachability by channel – Find the most effective channels for your cohort users.
- Create a campaign instantly – Start a campaign from the Cohort panel without interrupting your workflow.
Create Action for Cohorts
Follow these steps to create an action for a Cohort segment:
- Create or open a Cohort.
- Hover over the segment and click Take action.
- Enter the Segment name. Select Create campaign with this segment if you want to use it in a campaign immediately. Click SAVE.
- Under Campaign channel, use channel reachability insights to decide where to engage.
- Click Create campaign to use this cohort segment in your messaging campaign.
Updated about 1 month ago