
RFM
Use RFM analysis to understand and measure customer engagement.
Overview
RFM (Recency, Frequency, Monetary) on the Netcore CE dashboard is a feature that helps you understand your customers. It helps you identify your most loyal, highest paying, one-time, high-risk, and likely to churn customers. It segments users such as Loyal, Unsure, Hesitant, and so on based on their behavior. It analyzes the following factors: recency of the customer purchase, frequency of product purchase, and average order value. This analysis allows you to identify their loyal customers and create marketing strategies accordingly.
Refer to the given table to understand the key metrics of RFM.
| Metric | Description | Example |
|---|---|---|
| Recency | The frequency of the customer transactions or visits. | Ordered a product in the last 7 days/14 days/1 month/3 months. |
| Frequency | The frequency of the customer transactions or visits. | Purchases a product every 6 months/once in 3 months, |
| Monetary | The intention of the customer to spend or the purchasing capability of the customer. | The total order value has been Rs.5000 over the last 12 months, and the average order value is Rs.416. |
Video Tutorial
Refer to the video below to understand how to perform RFM analysis on the Netcore CE dashboard.
RFM Calculation
RFM calculation involves ranking customers based on their recency, frequency, and monetary scores. Here is how it works.
- Recency Score
- Rank customers from most recent to least recent.
- Divide them into three groups (1 to 3), where 3 indicates the most recent purchases.
- Frequency Score
- Rank customers by the number of purchases.
- Divide them into three groups (1 to 3), where 3 indicates high frequency.
- Monetary Score
- Rank customers based on total spending.
- Divide them into three groups (1 to 3), where 3 indicates high spending.
This results in nine segments (3 recency scores x 3 frequency scores) that help you understand customer behavior.
RFM Model
Refer to the given table to know the RFM models and how it is calculated in Netcore CE.
| Matrix | Criteria | Applicable Activities |
|---|---|---|
| RF (Engagement - Recency Frequency Matrix) |
| Push channels (Email, SMS, APN, BPN) and web/app activities except product purchase, page browse, and product view. |
| RFM (Recency Frequency Monetary Matrix) |
| App/ Web activity |
| RFDM (Recency Frequency Duration Matrix) |
| Page Browse |
Create RFM
- Log in to the Netcore CE dashboard.
- Navigate to Analytics > RFM. The RFM listing page appears.
The listing page displays two columns: All RFMs and Starred. All created RFMs appear under All RFMs, while starred RFMs are listed in the Starred column. To add a path to Starred, click  located to the left of the RFM name.
- Click CREATE RFM in the top right corner to create a new FRM. Refer to the table below for the options for creating a RFM.
| Option | Description |
|---|---|
| Duration | Select the time period for analyzing user activity. |
| Target audience | Select the group of users you want to analyze, including existing contacts, lists, or segments. |
| Channel | Select the communication channel for analysis. RFM is available for Email, SMS, App push, Web push, and App/ Web activity tracking. |
| Activity | Select the activity from the dropdown menu you want to analyze. |
Define Monetary Event
PrerequisitesBefore using this feature, ensure that:
- Your account has Vertica enabled.
- You are using IA 2.0.
- You understand that all data displayed will align with your Netcore CE dashboard's timezone settings.
When creating an RFM model:
- You can select any event (e.g., Checkout, Flight Booking, Subscription) as the monetary event.
- Use the “Monetary Event” toggle to mark the selected event accordingly.
- Select the Monetary Event Payload
After enabling the toggle, you view a dropdown of payloads related to the selected event. Only numeric (integer or float) payloads such as price, ticket_value, cart_total appear here. - Define Price-Based Filters (Optional)
You can narrow down your RFM segmentation based on price ranges from the payload. Follow the steps given below to define price-based filters.
- First, check the Filter by Price box.
- Select from the given operators:
is,is greater than,is greater than or equal to,is less than,is less than or equal to,is between.
You can define up to two price filters, combined using AND or OR logic.
Use Cases
| Event | Payload | Filter |
|---|---|---|
| Flight Booking | ticket_price | greater than 3000 AND less than 10000 |
| Subscription Done | price | is 799 |
| Add to Cart | cart_value | is between 1000 and 1500 |
Use Case 1: High-Value Flight Bookings
- Monetary Event: Flight Booking
- Payload: ticket_price
- Price Filter: is greater than 3000 AND is less than 10000
This RFM will segment customers based on when they last booked flights, how often they book flights, and will only include bookings with ticket prices between $3,000 and $10,000.
Use Case 2: Specific Subscription Plan
- Monetary Event: Subscription Done
- Payload: price
- Price Filter: is 799
This RFM will segment customers who have subscribed to your specific $799 plan, based on when they subscribed and how many subscriptions they have.
Use Case 3: Shopping Cart Analysis
- Monetary Event: Add to Cart
- Payload: cart_value
- Price Filter: none
This RFM will segment customers based on their cart addition behavior, using the cart value as the monetary component.
Use Case 4: Product Purchase
- Monetary Event: Product Purchase (PP)
- Payload: purchase_amount
- Price Filter: is greater than 500 AND is less than 1000
This RFM will segment customers who have made a purchase in the last 60 days, with a total spend between 500 and 1000.
- Frequency: Product Purchase Activity
- Frequency Filter: Purchase count within last 3-6 months
This RFM will also include customers who have made multiple purchases in the past 3 to 6 months, indicating repeat buying behavior.
Segmentation: Star, Loyal, Rising Users
This RFM will target Star, Loyal, and Rising users, offering premium products (worth 3000) at a discount, bringing the price to 500-1000. This ensures that these customers receive highly relevant, personalized offers based on both their loyalty and recent activity.
Once you have added the necessary parameters, click APPLY.
Based on your filters, a chart is generated. In the chart, the X-axis represents Recency, divided into three sections: Low, Medium, and High. The Y-axis represents Frequency, divided into three sections: Low, Medium, and High. Each section shows different categories of users, displaying both the number of users and the percentage of users for each category.
The users are divided into various types with unique tags/names. To understand their descriptions, refer to the table below.
Create RFM Matrix
| User type | Description |
|---|---|
| Need attention | Users who have been inactive recently. |
| At-risk | Users who have below-average RFM scores and are likely to churn. |
| Dormant | Users who have the lowest RFM scores. |
| Loyal | Users who have engaged multiple times and have the potential to become loyal users. |
| Unsure | Users who have above-average RFM scores but are yet to become loyal users. |
| Hesitant | Users who have above-average frequency but low recency. |
| Rising stars | Users who have a strong frequency score and the recency score is increasing. |
| Novice | Users who are your most recent users with low-frequency scores. Engage these customers to make a repeat purchase. |
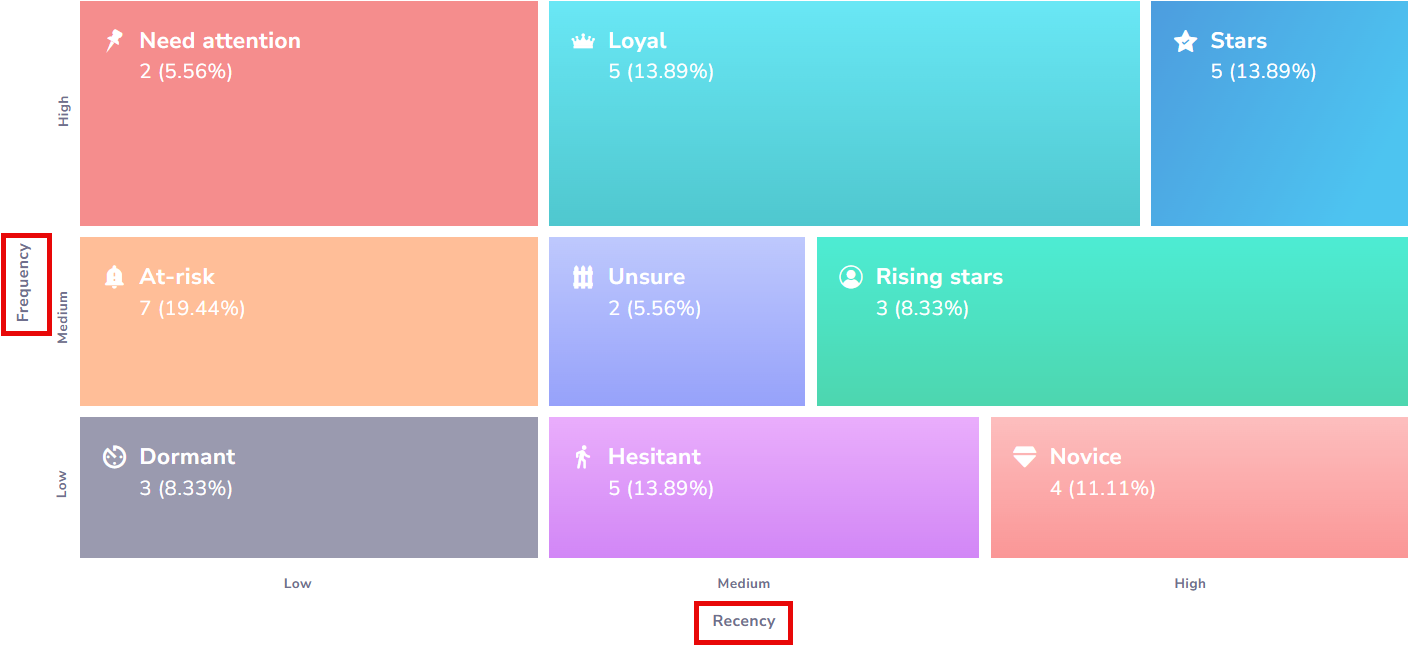
Example of an RFM Chart
After adding all desired filters to your RFM analysis, click SAVE in the top right corner. Your created RFM will appear on the RFM matrix listing screen.
Actionability in RFM
Actionability in RFM allows you to take immediate action once an RFM segment is created. The key benefits of this feature are:
- Check reachability by channel- Decide which channels can effectively engage the audience.
- Create a campaign instantly - Create a messaging campaign from the RFM pop-up, without leaving the workflow.
Create Action for RFM

Create Action for RFM
Follow the given steps to Create Action for RFM.
- Create or open an RFM segment.
- Hover over the RFM and click Take action.
- Specify the Segment name. Check the Create campaign with this segment option if you wish to use this segment in a campaign instantly. Click SAVE once done.
- Under Campaign channel, decide the best channel(s) based on reachability.
- Click Create campaign to use this segment directly in your messaging campaign.
Updated 22 days ago