
WhatsApp Billing Dashboard
View and analyze billing information for your WhatsaApp business account.
The WhatsApp billing dashboard on the Netcore CE and CPaaS platform offers a detailed view of your WhatsApp messaging usage and billing. It breaks down usage into categories and allows you to filter data by specific periods. You can manage your WhatsApp messaging and costs with a trend visualization tool and advanced filtering.
Navigate to Profile > Usage Overview and click View monthly consumption under WhatsApp. The WhatsApp Billing Dashboard page appears.
WhatsApp Billing Dashboard
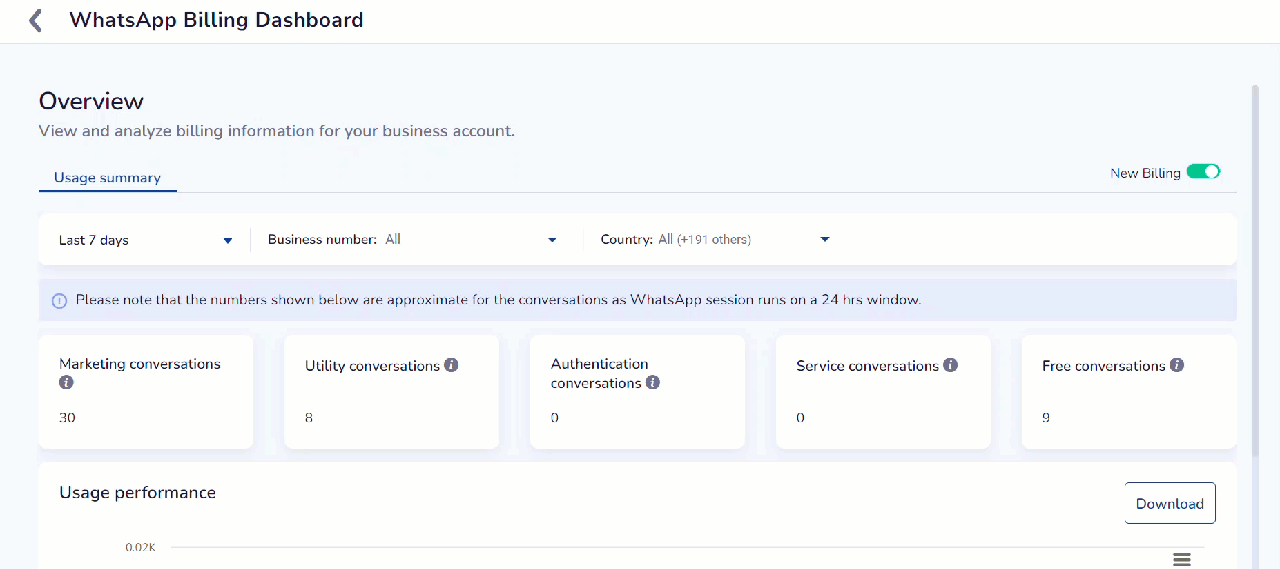
Billing AccuracyThe WhatsApp Billing dashboard shows estimated figures for conversations, as WhatsApp sessions operate on a 24-hour window.
User Summary
The Usage Summary gives you an overview of your WhatsApp message counts in different categories. Each category shows a different type of messaging interaction:
- Marketing conversations: These include promotions, offers, updates, or invitations to take action. Any conversation not about utility or authentication is a marketing conversation.
- Utility conversations: These handle specific requests or transactions and provide updates about ongoing transactions, such as purchase notifications and billing statements.
- Authentication conversations: These verify users with one-time passcodes during account verification or recovery.
- Service conversations: These help resolve user-initiated inquiries and assist with their requests.
- Free conversations: These are messages exchanged between your business and users free of charge. A conversation starts with the first business message and lasts 24 hours, whether started by the business or in response to a user message.
Functionality
The following functionalities are available on the WhatsApp billing dashboard:
Duration Filter
You can adjust the time period for viewing your messaging usage data to analyze trends, compare performance, and align with your budgeting needs.
By default, the dashboard shows data for the current month. To change this, use the duration filter labeled Last 7 days and select a different time period from the dropdown list. Refer to the table below for the list of predefined periods.
| Time Period | Description |
|---|---|
| Yesterday | Shows data for the previous day. |
| Last 7 Days | Shows data for the most recent seven days, including today. This is the default value. |
| This Month | Shows data for the current calendar month. |
| Last 30 Days | Shows data for the previous 30 days from the current date. |
| Last 90 Days | Shows data of the last 90 days' activity. |
You can select a custom date range if you have not met the options. To do this:
- Open the calendar interface. In the calendar pop-up, you can navigate through months and select specific start and end dates.
- Select the desired range and click Apply to refresh the dashboard with the data from the specified period.
Business Number
You can filter your report to focus on a specific WhatsApp business number. This lets you view usage and billing details for that particular number, helping you track performance and manage costs for individual business lines. Select all or a business number from the dropdown menu and click Apply.
Country
You can filter your report by country to see messaging data and billing information specific to a particular location. This feature helps you analyze usage patterns and costs associated with different regions, making it easier to manage international operations and understand regional performance. Select all or a country from the dropdown menu and click Apply.
Download Report
You can export usage data and download a CSV file containing the usage data displayed on the dashboard. Click ![]() to download the chart as a PNG/ JPEG image, PDF document or SVG vector image.
to download the chart as a PNG/ JPEG image, PDF document or SVG vector image.
Click Download report to download your reports. The Download report pane appears. You can add or select the email address to which you want to receive your CSV file.
Updated 29 days ago