
Reports
Track campaign success with our in-depth reports.
Important Note: Change Percentage Engagement Metrics for Journey, Campaign & Dashboards for Summary ReportsFrom 19 May 2025 onwards, the following engagement metrics will use the delivered count as the denominator, ensuring more accurate campaign performance insights.
- Open Rate
- Click Rate
- Unsubscribe Rate
- Conversion Rate
- On the Email Performance page, the metrics for Forwarded
The Percentage Engagement Metrics calculation uses the number of clicks/ number of emails delivered. May 15th onwards, the denominator will consist of number of emails delivered.
For example, if 100 users were targeted in a campaign, but only 90 emails were delivered due to reasons like gateway errors or frequency capping, and 20 users clicked, with the old calculation, the click rate would be 20/100*100 = 20%
With the new calculation, the click rate is 20/90*100 = 22.22%, reflecting a higher rate due to the smaller denominator.
This aligns with historical data as well, indicating that the rates reported increase as a result of this adjustment. Refer to this here for a detailed explanation of the changes.
Gain insights into your campaign performance with Reports. Understand the impact of your campaigns on your users and make informed product decisions. Our comprehensive reports helps you to optimize your strategies.
We have two types of reports:
- Summary Reports: Provides statistics on campaigns sent.
Summary Report
A Summary Report provides analytics of the key metrics for a specific campaign. This report is directly downloaded as a CSV file to your device, making it easy to access and analyze the data.
Create Summary Report
Follow the steps given below to create a Summary Report.
- Log in to the Netcore CE dashboard.
- Click Download Report to download your reports > Summary Report. The Export report pane opens.
- Select Channel, which includes Email, SMS, App Push, Web Push, and Whatsapp.
- Select Summary Report under Report Type. You can choose to download the report immediately or schedule later.
- Choose the method for receiving the report and click Download.
- Detailed Reports: Provides the exact numbers of the campaigns, including the user names.
Detailed Report
The Custom Detailed Report on the Netcore CE dashboard lets you create personalized reports. This functionality allows you to customize their reports with detailed campaign and activity data information, such as bounce rates, open times, click-through rates, and conversion metrics. You can schedule reports to receive them regularly, such as daily, weekly, or monthly. This ensures you get updated data consistently. For added security, a password is sent to a selected mobile number, which is used to view downloaded reports.
Reports can be delivered in two ways:
- Email: Sent directly to your email address.
- FTP: The report is downloaded via File Transfer Protocol (FTP), a method for downloading files from a server to your computer. In this case, you can securely download your report from the server and send it to your device.
Create Detailed Report
Follow the steps given below to create a Detailed Report.
- Click Download Report to download your reports. The Export report pane opens.
- Select Channel, which includes Email, SMS, App Push, Web Push, and Whatsapp.
- Select Detailed Report under Report Type.
- Select contact type: Contact master or User data table.
- After filling in the required details for your preferred messaging channel, click Download. The Detailed Report will be delivered via your chosen method, and you can access it using the password sent to your mobile number.
On your dashboard, navigate to Engage to view the Reports for Campaigns, Journeys, On-site Messages, and Content/Product Personalization.
Refer to the table below to learn the available categories.
| Category | Description |
|---|---|
| All | Displays all campaigns, irrespective of their current status. |
| Draft | Displays campaigns that are saved but not yet active or scheduled. |
| Running | Displays campaigns that are currently live and being viewed by users. |
| Paused | Displays campaigns that are temporarily halted but can be resumed. |
| Scheduled | Displays campaigns set to go live at a future date and time. |
| Completed | Displays campaigns that have finished their run according to set criteria. |
| Suspended | Displays campaigns that are stopped due to issues or manual suspension. |
| Archived | Displays campaigns that are no longer active and have been stored for record-keeping. |
Here are the other functionalities on the Reports dashboard.
Download Reports
- Navigate to Engage section from the dashboard.
- Click on Download report to download your reports. The Export report pane opens.
Download Report
Report Download Limit:
- Select a maximum of 150 campaigns per report when downloading reports for analysis.
- If you require data for more than 250 campaigns, reports will be sent via email as a ZIP file.
- Reports are available for download based on our data retention policy, which retains data for one year. Therefore, only reports from the past year are accessible.
- You can download reports for a custom date range, with a maximum range of three months.
- The Custom Detailed Report will be delivered via your chosen method, and you can access it using the password sent to your mobile number.
- The Summary Report is downloaded on your device immediately.
- Add the detailed information.
| Elements | Description | Available |
|---|---|---|
| Select Channel | Allows you to select the channel you want to generate a report for. | Email, SMS, WhatAapp, Web Push, App Push, In-app, Web message |
| Report Type | Allows you to select the report you want to download. | Email, SMS, Whatsapp, Web Push, App Push, In-app, Web message |
| Select Duration | - Duration: Refers to the length of time you want to generate the report: Today, Yesterday, Last 7 Days, Last 1 Month, Last 3 Months. Custom range) - Tags: Allows you to download reports categorized under specific tags. - Campaign name: Allows you to choose one or more campaigns to make a report about. | Email, SMS, Whatsapp, Web Push, App Push, In-app, Web message |
| Select where to send | Allows you to select the method you want to receive the report. - Select method | Email, SMS, Whatsapp, Web Push, App Push, In-app, Web message |
| Download | Allows you to download the report immediately. | Email, SMS, Whatsapp, Web Push, App Push, In-app, Web message |
View in Percentage/Number
View in Percentage presents data in form of percentage, while View in Number displays the exact count of the data.
Click  on the top right of the campaigns page to view the data as per your choice.
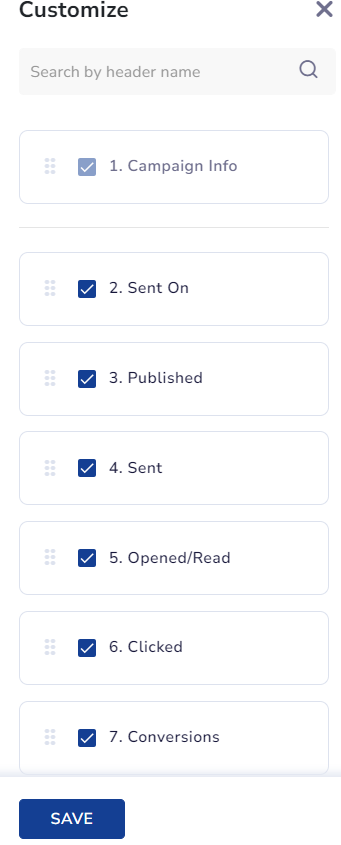
Customize
Personalize your report by choosing specific campaign metrics. Click  on the top right of the campaigns page to select the metric you need for your desired report.
Customize Report
Refer to the table below to know about the metrics available to customize your report.
| Metrics | Description |
|---|---|
| Campaign Info | Key details and overview of your campaign. |
| Sent On | Date and time the email was sent. |
| Published | Date and time the campaign was published. |
| Sent | Total number of campaigns sent. |
| Opened/Read | Number of campaigns (e.g.: Emails) opened or read. |
| Clicked | Total number of campaigns clicked. (e. g.: App Push Notifications) |
| Conversions | Number of completed desired actions. |
| Revenue | Total income generated from the campaign. |
| Delivered | Successfully delivered campaigns to users. |
| Not Sent | Campaigns that were not sent out. |
| Unsubscribed | Users who opted out. |
| Bounce | Emails that were returned undelivered. |
| Abuse | Reports of email abuse or spam. |
| Undelivered | Campaigns that failed to deliver. |
| Submitted | Forms or surveys that were submitted. |
| AMP Submission | Number of AMP format emails submitted. |
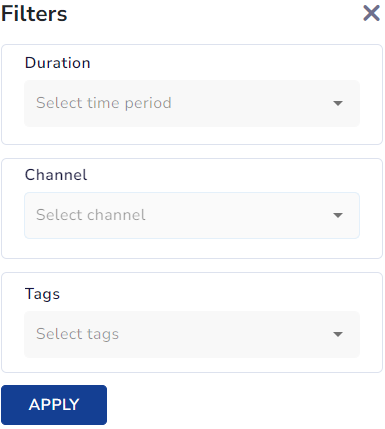
Filters
Click  on the top right of the campaigns page to refine your report by applying specific filters to focus on relevant data. Narrow down results by selecting criteria such as duration, channel, and tags.
Filters in Report
Refer to the table below to know about the options available in Filters.
| Options | Description |
|---|---|
| Duration | Set the time range for the campaign report. (e. g.: Yesterday, Last 7 days, Last 30 days) |
| Channel | Select the communication method used in the campaign. |
| Tags | Select labels categorize under specific campaigns to filter campaign data. |
Search
Click ![]() on the top right of the campaigns page to find relevant information using keywords or phrases quickly. Search by campaign name or ID for precise results.
on the top right of the campaigns page to find relevant information using keywords or phrases quickly. Search by campaign name or ID for precise results.
Schedule Reports
The Schedule Reports feature allows you to automate the generation and delivery of reports based on your specified criteria. You can schedule summary and custom detailed reports at your preferred frequency. This section provides step-by-step instructions on planning and configuring reports.
Steps to Schedule a Report
Schedule Report
- Log in to the Netcore CE dashboard.
- Click on Download Report to download your reports. The Export report pane opens.
- Select Schedule Report. Add details for the new report schedule.
- Name the Report: Provide a descriptive name for your report scheduler.
- Set Start & End Dates: Specify the start and end dates for the report. The generated report will include all campaigns within this selected duration.
- Select Frequency, which includes daily, weekly, and monthly.
- Daily: Choose from options like Today, t-1 (day before yesterday), t-3 (three days ago), t-7 (seven days ago), t-15 (fifteen days ago), t-30 (thirty days ago), where t=Yesterday (We process the report daily post midnight).
- Weekly: Define the specific day of the week you want to receive the report.
- Monthly: Note that report generation can take up to 48 hours after the last day of the calendar month.
- Once you have configured all settings, save your configurations to schedule the report. Ensure that the settings meet your requirements and confirm to finalize the scheduling process.
- Scheduled reports can be accessed on the Netcore CE dashboard in the Analytics section> Scheduled Reports.
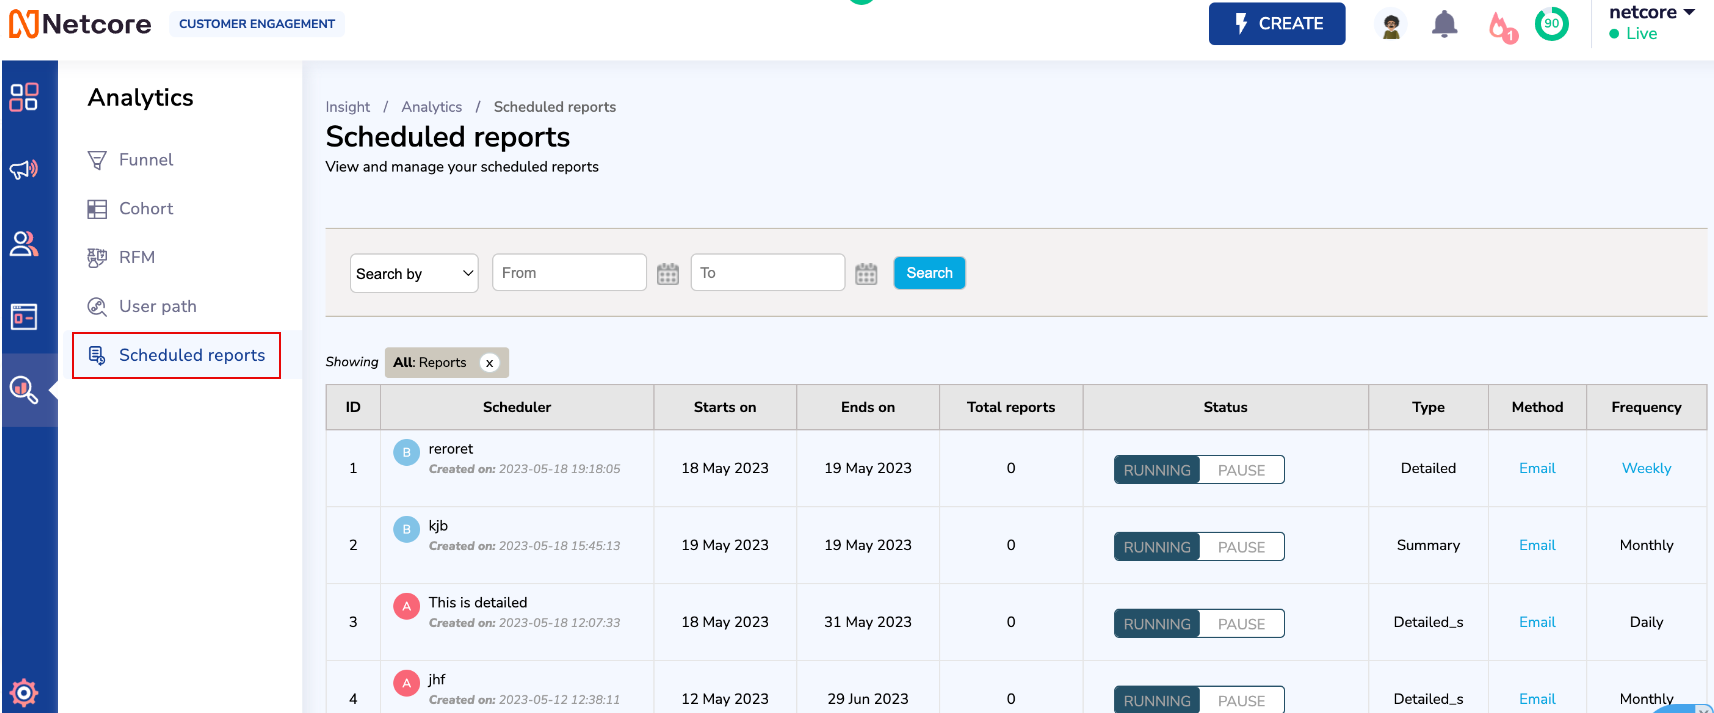
View Scheduled Reports under Analytics section
Note
- Total scheduled reports limit has been increased from 11 to 20. This enhancement allows users to schedule up to 20 reports.
- Ensure your email address or preferred destination is correctly set up to receive scheduled reports.
- Reports will be generated automatically according to your specified schedule and delivered to the designated destination.
Difference Between Summary and Detailed Reports
When reviewing campaign performance, you may see differences between the summary report shown in the dashboard and the detailed report you download. This is expected. Both reports use different data structures and should not be compared directly without using the correct filters.
Learn how each report works and why counts may differ, especially for status-based metrics.
1. Latest Status Workflow
This is applicable for the following channels: (Email, SMS, APN, WPN). In detailed reports, each row represents a single user or device. The Status column always shows the latest state of the message. Earlier states are not stored as separate entries.
For example, if user A is sent an email, this is how the report will be generated for the user:
| Step | Event | Status Shown in Detailed Report |
|---|---|---|
| 1 | Email is sent | Sent |
| 2 | User clicks the email | Clicked (updated from Sent) |
If you filter the detailed report for Status = Sent, this user will not appear because their status has moved forward to Clicked.
Why this impacts your comparison
- Summary report: Counts each status event separately.
- Detailed report: Stores only the final status for each user/device.
Matching the "Sent" count
To match the Sent count from the summary report, include all rows where the message has moved past the Sent stage.
Statuses to include for Total Sent:
| Status | Meaning |
|---|---|
| Sent | Message was sent |
| Delivered | Delivered implies it was sent |
| Opened | Message was delivered and opened |
| Clicked | Message was delivered, opened, and clicked |
Formula: Total Sent = Sent + Delivered + Opened + Clicked
2. Users vs. Devices in Push Channels
This applies to both App Push and Web Push. Push notifications are sent to device tokens, not directly to user IDs. This creates natural differences in how summary and detailed reports count targets.
How each report counts
| Report Type | What it Counts | Example |
|---|---|---|
| Summary Report | Unique users (User IDs) | 1 user |
| Detailed Report | Individual devices/tokens | 2 device rows |
Example scenario
A user is logged into both an iPhone and an iPad.
| Report | What You See |
|---|---|
| Summary Report | 1 target (unique user) |
| Detailed Report | 2 rows (one per device) |
For push campaigns, it is normal to see higher row counts in detailed reports because each device is listed separately.
Updated 25 days ago