
PX-Report
Get actionable insights into how users interact with In-app nudges. PX Reports allow you to track engagement, click behavior, and goal completions across nudge journeys. Choose from user-level or aggregated summaries to evaluate the performance of each journey, variant, or day-wise interaction trends.
Use these reports to validate campaign effectiveness, identify drop-offs, and make informed decisions about your products.
Export directly from:
- Export Report side drawer in the Nudge Journey section.
- Journey nudge directly.
Report Types
PX supports five types of reports to help you analyze user behavior, nudge performance, and goal conversion across journeys.
1. User Level Report
A detailed, row-level report that captures how individual users interact with nudges. Includes event timestamps, interaction types, goal attribution, and device/app metadata.
Key insights:
- Views and clicks per user
- Conversion (goal) attribution per nudge
- Device, OS, App, and SDK version tracking
2. Nudge-wise Aggregate Report
Provides aggregated performance metrics for each nudge across selected journeys and time periods. Useful to:
- Compare engagement across nudges
- Monitor which nudges perform better in driving clicks or conversions
3. A/B-Wise Aggregated Report
Summarizes results based on A/B variants in journeys with A/B nodes. Ideal for:
- Comparing control vs. variant performance
- Identifying top-performing nudge variants
Only journeys with A/B tests will appear in the dropdown when this report type is selected.
4. Day-wise Summary Report
Breaks down engagement metrics by day. Helps in:
- Spotting performance trends over time
- Analyzing the impact of specific date ranges
5. Summary Report(Journey-level)
Offers a consolidated overview of each journey’s performance. Includes:
- Cumulative views, clicks, and conversion stats across all nudges in the journey
- High-level snapshot without exposing user-level data
Download PX Reports
You can download PX reports directly from the Nudge Journey section on the PX dashboard. The report options and flow differ slightly based on the report type.
User Level Report or Journey-level Summary Report
Use this method to get detailed or journey-level aggregated reports for individual nudges.
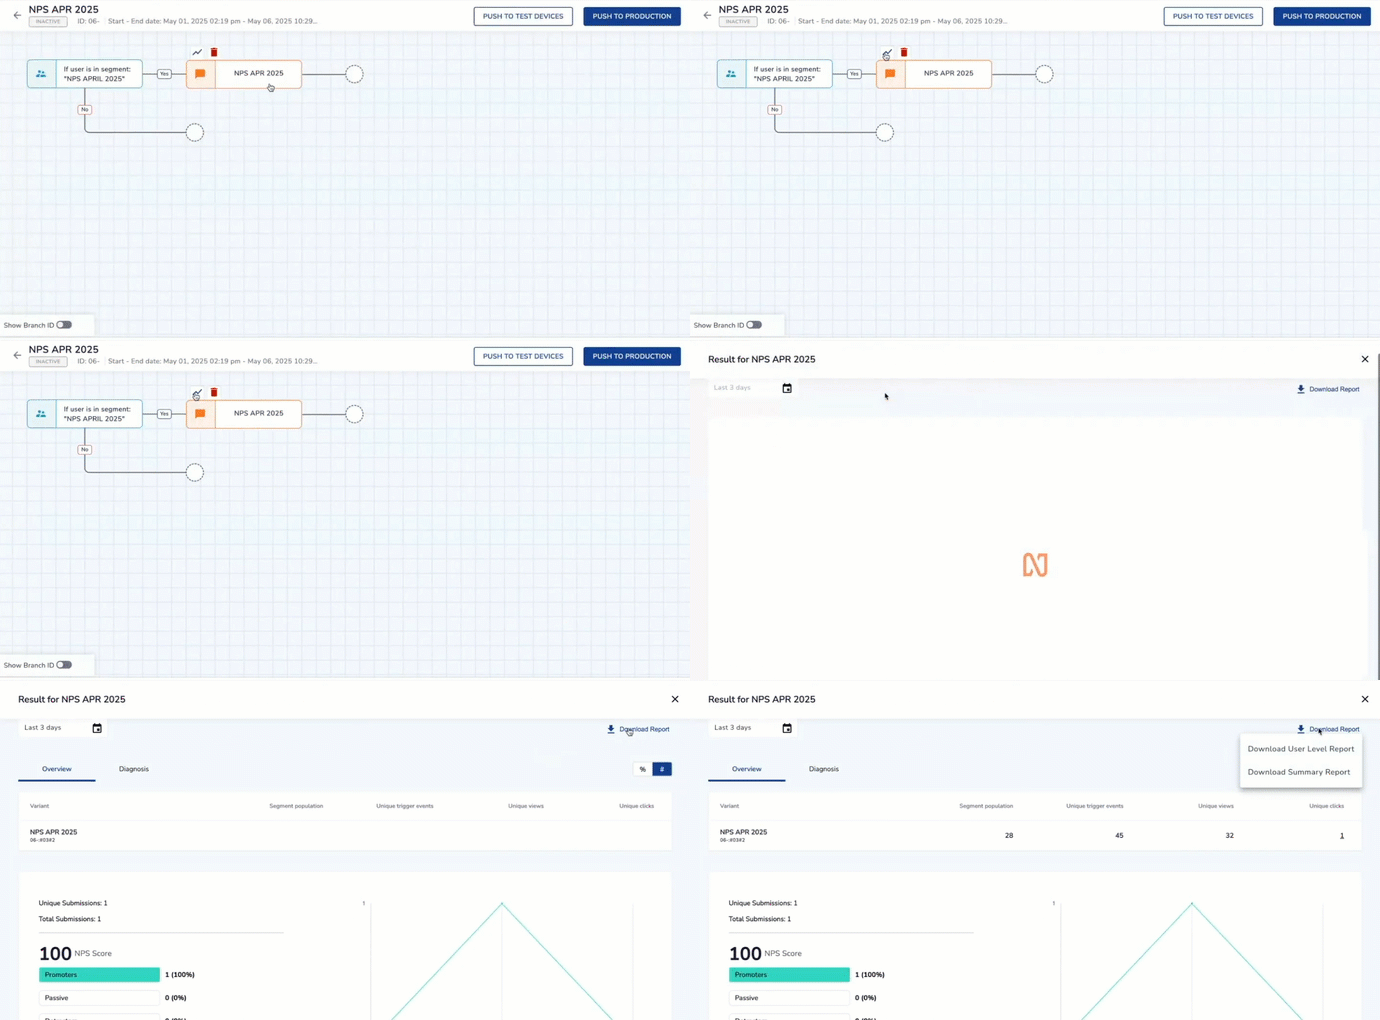
- Navigate to Nudge Journey on PX dashboard.
- Click on any active or inactive nudge journey.
- Inside the selected journey, locate the nudge for which you want the report.
- Click the Report icon next to the nudge. The Results section appears.
- Click Download report. Choose between User level Report or Summary Report from the drop-down.
These reports are nudge-specific and reflect individual or aggregated nudge performance within a journey.
UpdateWe have introduced user-level reports for all Nudges that includes at-least one unique click. This addition, alongside the six existing ones, brings the total count of Nudges to 29.
User Level Report Column
The User Level Report includes a detailed set of fields that help you understand how each user interacted with a nudge. The table below explains the key columns included in the exported CSV:
| Column | Description |
|---|---|
| Primary Key | Unique identifier for each row in the report. |
| GUID | Global User ID of the user who viewed or interacted with the nudge. |
| Report Duration | Date range you selected while exporting the report. |
| App Name | Name of the application where the nudge was shown. |
| App ID | System identifier of the application. |
| Action Timestamp | Exact timestamp of the user's interaction. |
| Interaction Map Name | The internal interaction map where the nudge was displayed. |
| Nudge Name | Name of the nudge the user saw or interacted with. |
| Nudge Type | The type of nudge displayed (e.g., Tooltip, Modal, Bottom Sheet). |
| button1_clicked | Indicates if the primary CTA was clicked. |
| button2_clicked | Indicates if the secondary CTA was clicked. |
| image_clicked | Indicates if the image was clicked. |
| Nudge Action | The final recorded action (view, click, dismiss, no action, conversion). |
| Goal Event Name | The attributed conversion event name (if configured). |
| OSType | The operating system used by the user (Android/iOS). |
| OSVersion | Version of the operating system. |
| AppVersion | Version of the app installed. |
| SDKVersion | PX SDK version running on the device. |
| Make | Device manufacturer. |
| Model | Device model. |
Sample Reports
This sheet includes sample reports (for User-Level Report ) for Nudges where at-least one call to action button is available.
How Engagement is Measured
PX classifies all recorded activity into views, clicks, or conversions. The logic below explains how each action is treated in the User Level Report:
Views include the following actions:
- button1_clicked
- button2_clicked
- image_clicked
- backdrop_dismissed
- noaction_screenchanged
Clicks include only:
- button1_clicked
- button2_clicked
- image_clicked
Conversions
If the user completes the configured goal event:
- Nudge Action is marked as
conversion - Goal Event Name contains the event name
- Button fields (
button1_clicked,button2_clicked,image_clicked) show N/A
If a journey does not have a configured goal, the Goal Event Name and conversion fields will appear as N/A.
Understanding Attribution Differences
The conversion numbers in the User Level Report may not always match what you see in the panel UI. This is expected and happens because the UI applies a funnel-based attribution model, while the CSV includes all valid events within your selected date range.
For example:
- If a user viewed a nudge on 2 Aug and completed the goal on 3 Aug, the CSV will count it.
- The UI will not count it unless the funnel specifically includes cross-day attribution.
This difference is intentional and ensures more flexible offline analysis in the CSV.
Nudge-wise Aggregate, A/B-wise Aggregate, or Day-wise Summary Report
Use this flow when you want a consolidated report across journeys or for comparative analysis
- Navigate to Nudge Journeys on the Netcore PX dashboard.
- Click
 Download report screen appears.
 - The Export Report side drawer opens. Select the following:
- Report Type: Choose the report type you want to export(Nudge-wise, A/B-wise, Day-wise).
- Duration: Select a custom date range for which you want to download the report.
- Journey Name: Filter by All, Active, or Inactive. Use Select All if needed.
- Email: Choose up to 5 email addresses from the panel users.
- Click EXPORT. The report is sent to your email address.
NoteOnce you have downloaded the report, allow up to 10 minutes to receive the report via email. Typically, the report will be delivered within 10 minutes.
Report Export Rules and Limits
While exporting Nudge-wise Aggregate, A/B-wise Aggregate, or Day-wise Summary reports, the following limits apply:
- Duration: You can export reports for up to 90 days from the current date. Dates beyond 90 days are disabled in the calendar.
- Default Range: The last 4 days are preselected by default, similar to the existing PX behavior.
- Journey Selection: Filter journeys by All, Active, or Inactive using the dropdown. A Select All option is available.
- Email Recipients: You can select up to 5 email addresses from active panel users. Once five emails are selected, the remaining options appear greyed out.
- A/B-wise Aggregate Rule: When exporting an A/B-wise aggregate report, only journeys that contain an A/B node appear in the Journey dropdown.
Updated about 14 hours ago